Using OmicLearn
OmicLearn enables researchers and scientists to explore the latest algorithms in machine learning (ML) for their usage in proteomics/transcriptomics.
The core steps of the pipeline are Preprocessing, Missing Value Imputation, Feature Selection, Classification, and Validation of selected method/algorithms and are presented in the flowchart below:

Figure 1: Main steps for the workflow of OmicLearn at a glance
Uploading data
Own data can be uploaded via dragging and dropping on the file menu or clicking the link. The data should be formatted according to the following conventions:
The file format should be
.xlsx (Excel),.csv (Comma-separated values)or.tsv (tab-separated values). For.csv, the separator should be eithercomma (,)orsemicolon (;).Maximum file size is 200 Mb.
‘Identifiers’ such as protein IDs, gene names, lipids or miRNA IDs should be uppercase.
Each row corresponds to a sample, each column to a feature.
Additional features should be marked with a leading underscore (
_).
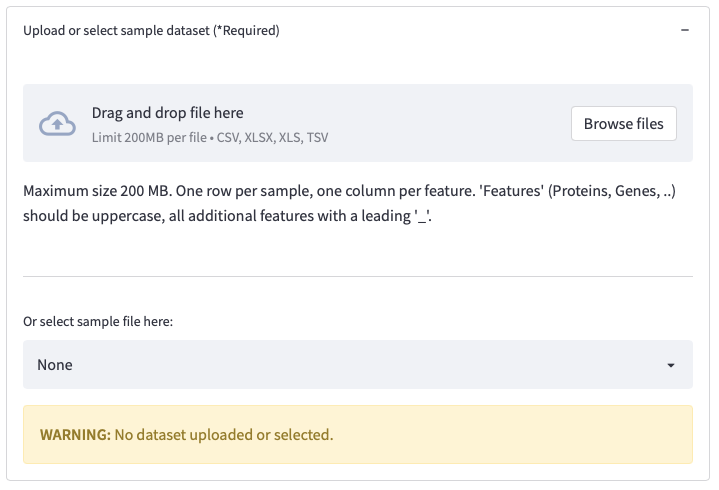
Figure 2: Uploading a dataset or selecting a sample file
The data will be checked for consistency, and if your dataset contains missing values (NaNs), a notification will appear. Then, you might consider using the methods listed on the left sidebar for the imputation of missing values.
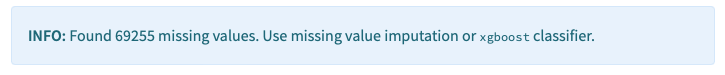
Figure 3: Missing value warning
Sample Datasets
OmicLearn has several sample datasets included that can be used for exploring the analysis, which can be selected from the dropdown menu.
Here is the list of sample datasets available:
1. Alzheimer Dataset
📁 File Name: Alzheimer.xlsx
📖 Description: Proteome profiling in cerebrospinal fluid reveals novel biomarkers of Alzheimer’s disease
🔗 Source: Bader, J., Geyer, P., Müller, J., Strauss, M., Koch, M., & Leypoldt, F. et al. (2020). Proteome profiling in cerebrospinal fluid reveals novel biomarkers of Alzheimer’s disease. Molecular Systems Biology, 16(6). doi: 10.15252/msb.20199356.
2. Sample Dataset
📁 File Name: Sample.xlsx
📖 Description: Sample dataset for testing the tool
🔗 Source: -
Sidebar: Selecting Parameters
OmicLearn has a large variety of options to choose from which are detailed in the methods. The parameters can be selected in the sidebar.
Moreover, after changing the parameters, you are asked to re-run the analysis. Each analysis result will be stored in the Session History section.
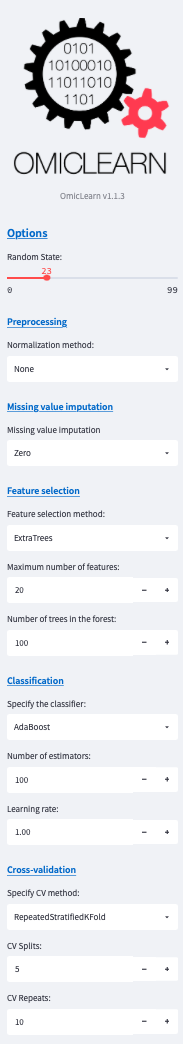
Figure 4: OmicLearn sidebar options
Main Window: Selecting data, define workflow, and explore results
Data Selection
After uploading the data, the data will be displayed within the OmicLearn window and can be explored. The dropdown menu Subset allows you to specify a subset of data based on values within a column. This way, you can exclude data that should not be used at all. An example use case could be that you collected data from different sites and want to exclude a site.
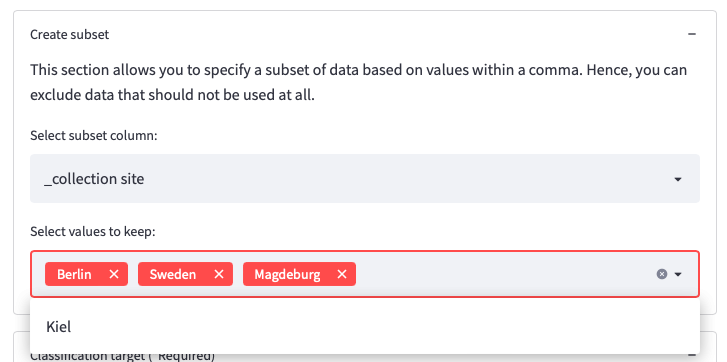
Figure 5: Example usage for Subset section
Within Features, you should select the target column. This refers to the variable that the classifier should be able to distinguish. As we are performing a binary classification task, there are only two options for the outcome of the classifier. By assigning multiple values to a class, multiple combinations of classifications can be tested.
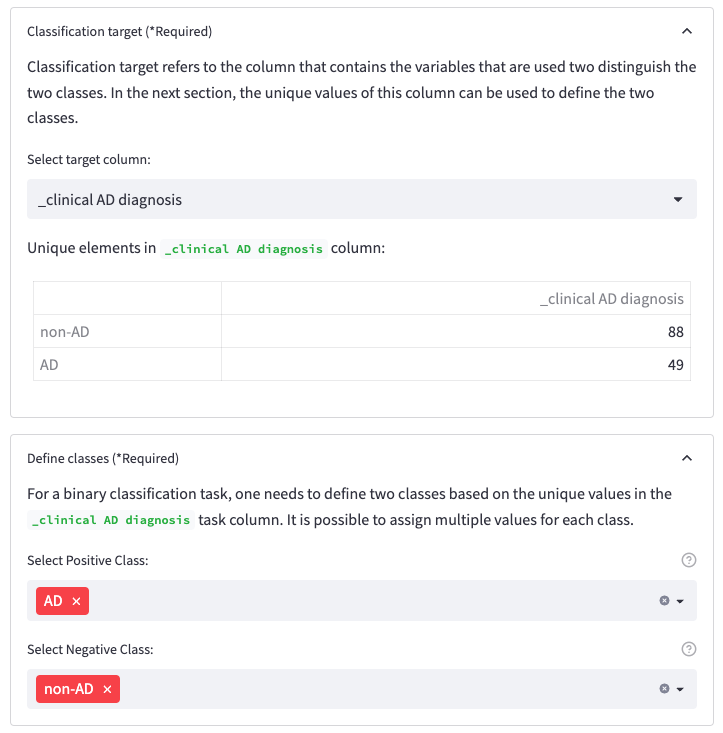
Figure 6: Classification target section for selecting the target columns and Define classes section for assigning the classes
Furthermore, Additional Features can be selected. This refers to columns that are not your identifiers such as protein IDs, gene names, lipids or miRNA IDs (not uppercase and have a leading underscore (_). There is also an option to upload a file with multiple additional features that should be included for training.
To utilize this option, you should upload a CSV (comma , separated) file where each row corresponds to an additional feature to be included for training. The file does not need to include a header (title row).
Example file should like look:
_additional_feature_1
_additional_feature_2
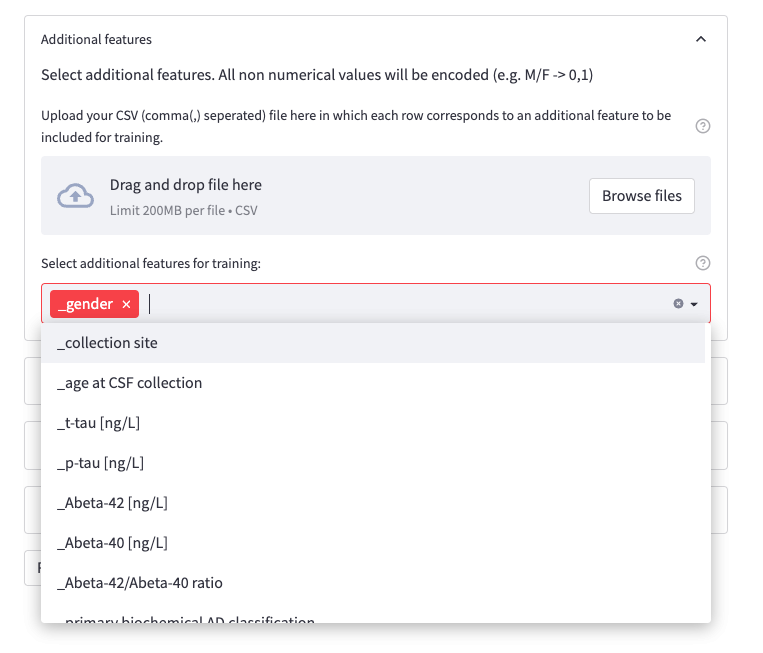
Figure 7: Sample case for Additional Features option
The section Exclude features enables users to exclude selected features manually. This can be useful e.g., when wanting to asses performance without a top feature. There is also an option to upload a file with multiple features that should be excluded.
To utilize this option, you should upload a CSV (comma , separated) file where each row corresponds to a feature to be excluded. The file does not need to include a header (title row).
Example file should like look:
protein_A
protein_B
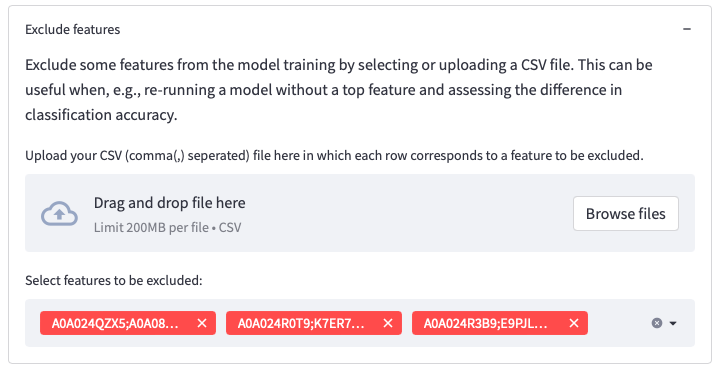
Figure 8: Selections on the dataset
The option Cohort comparison allows comparing results over different cohorts (i.e., train on one cohort and predict on another)
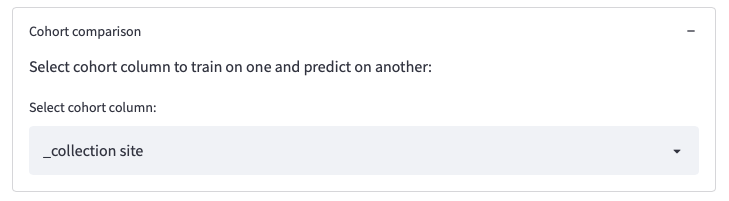
Figure 9: Selections on the dataset
Running the Workflow
After selecting all parameters you are able to execute the workflow by clicking the Run Analysis button.
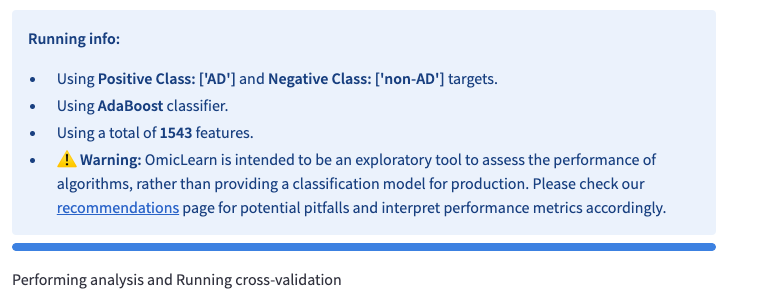
Figure 10: Running info
Analysis results and plots
Once the analysis is completed, OmicLearn automatically generates the plots together with a table showing the results of each validation run. The plots are downloadable as .pdf and .svg format in addition to the .png format provided by Plotly.
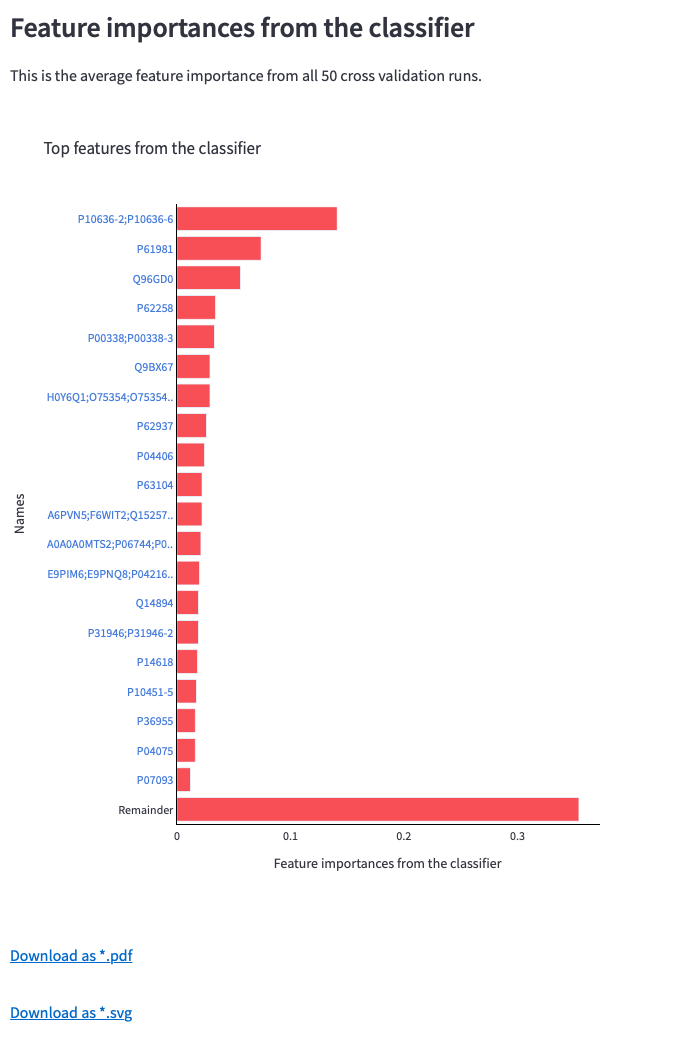
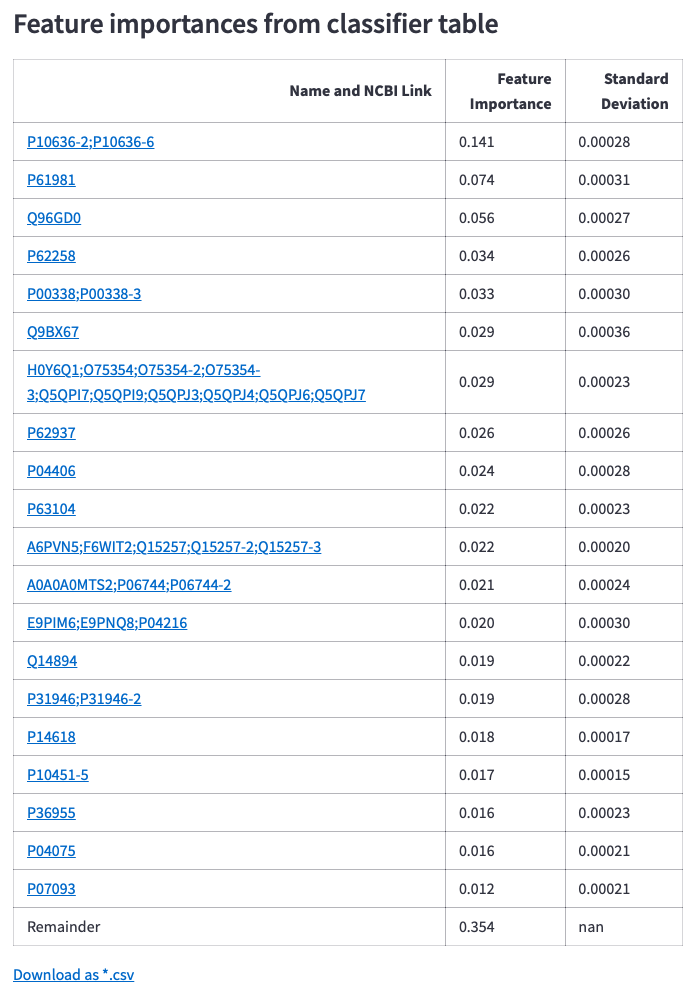
Figure 11: Bar chart for feature importance values received from the classifier after all cross-validation runs, its table containing links to NCBI search and download options
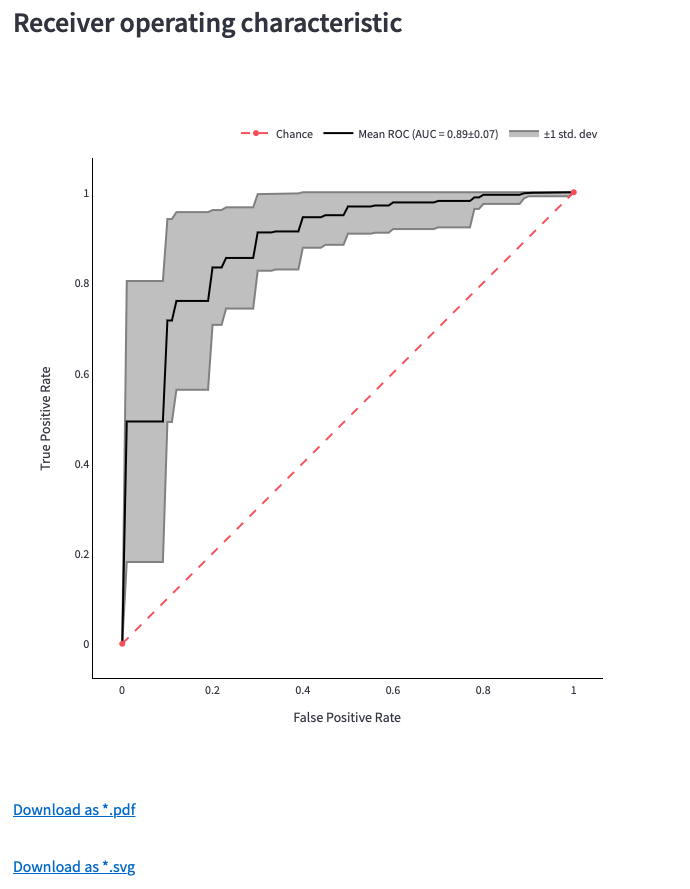
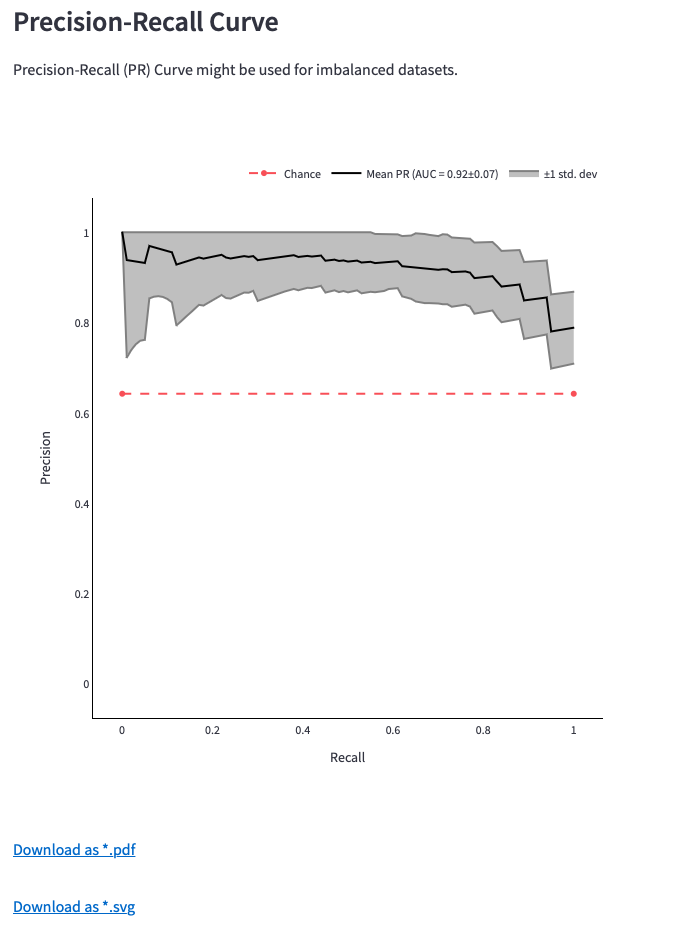
Figure 12: Receiver operating characteristic (ROC) Curve, Precision-Recall (PR) Curve and download options
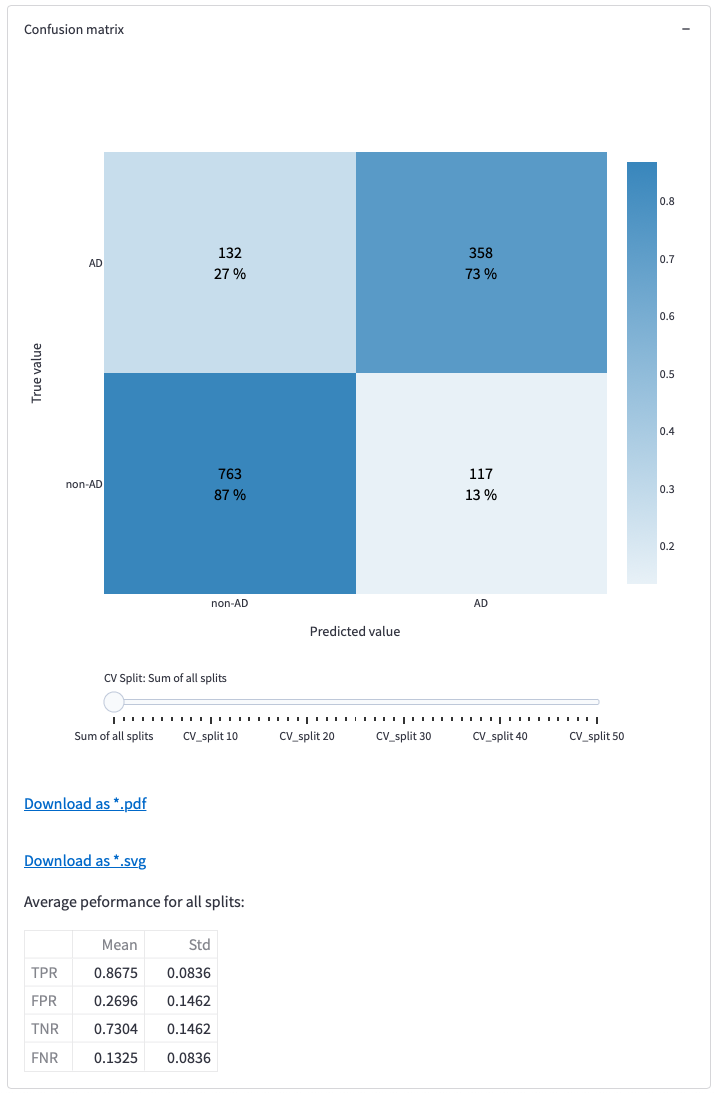
Figure 13: Confusion matrix, slider for looking at the other matrix tables and download options
OmicLearn generates a Summary to describe the method. This can be used for a method section in a publication.
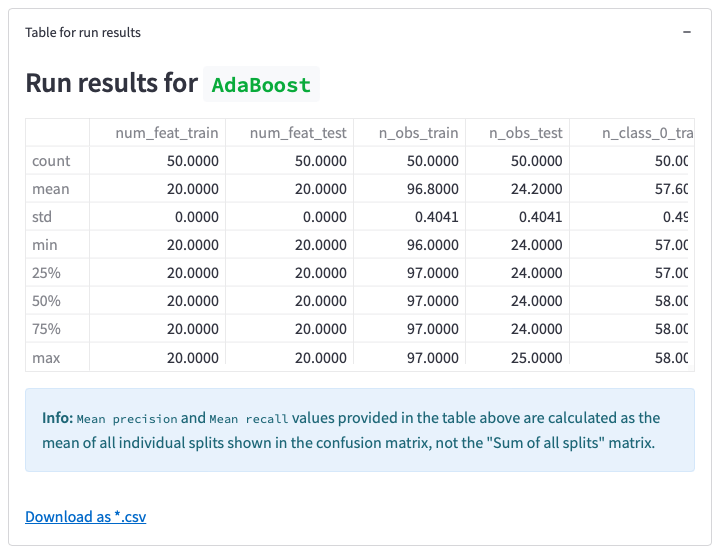
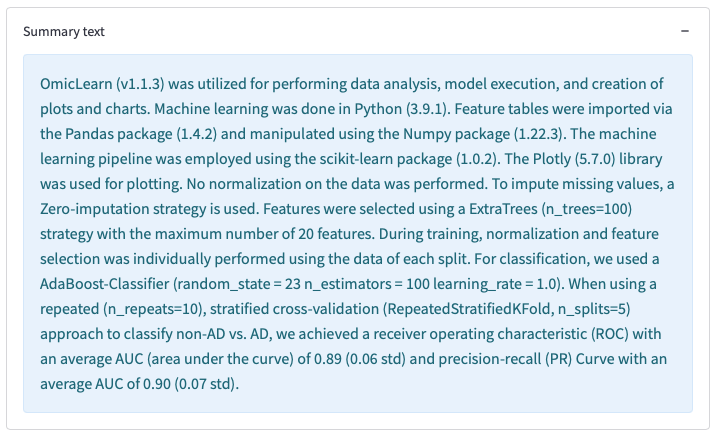
Figure 14: Results table of the analysis, its download option, and auto-generated Summary text
Checking the Session History
Each analysis run will be appended to the Session History so that you can investigate the different results for different parameter sets.
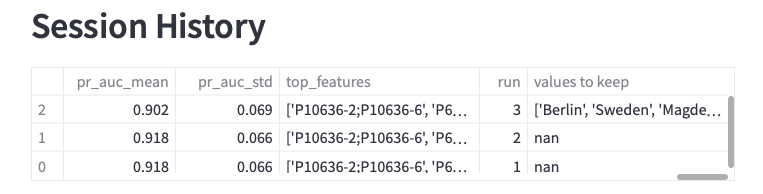
Figure 15: Session history table and download option